 Welcome to the tutorial where we will provide SAP BEx Analyzer overview. You will learn what is SAP BEx Analyzer and how to execute queries in this SAP BEx tool. Additionally, we will show how to navigate in reports generated by BEx Analyzer. This tutorial is part of our free SAP BW course.
If this is the first time you’re trying to run a simple query in SAP BEx Analyzer, then this is the right tutorial for you. This tutorial provides SAP BEx Analyzer overview, explains how to execute a query in SAP BEx Analyzer and how to navigate through the report in BEx Analyzer. This tutorial describes the steps involved in this process.
SAP BEx Analyzer Overview
SAP BEx Analyzer is MS Excel based BEx tool that is primarily used for analysis and reporting. Simply put, the data is shown in Microsoft Excel workbooks and these workbooks allow you to do drill-down and filtering using Online Analytical Processing (OLAP) functions of SAP BW. OLAP basically does multidimensional data analysis. You can continue to use the standard features of Excel along with the augmented features offered by SAP BEx Analyzer. As needed, Visual Basic Applications (VBA) can be used to develop custom programs.
For the ease of understanding, this tutorial is divided into the following two sections:
- Executing the Query
- Navigation in the Report
Executing the Query
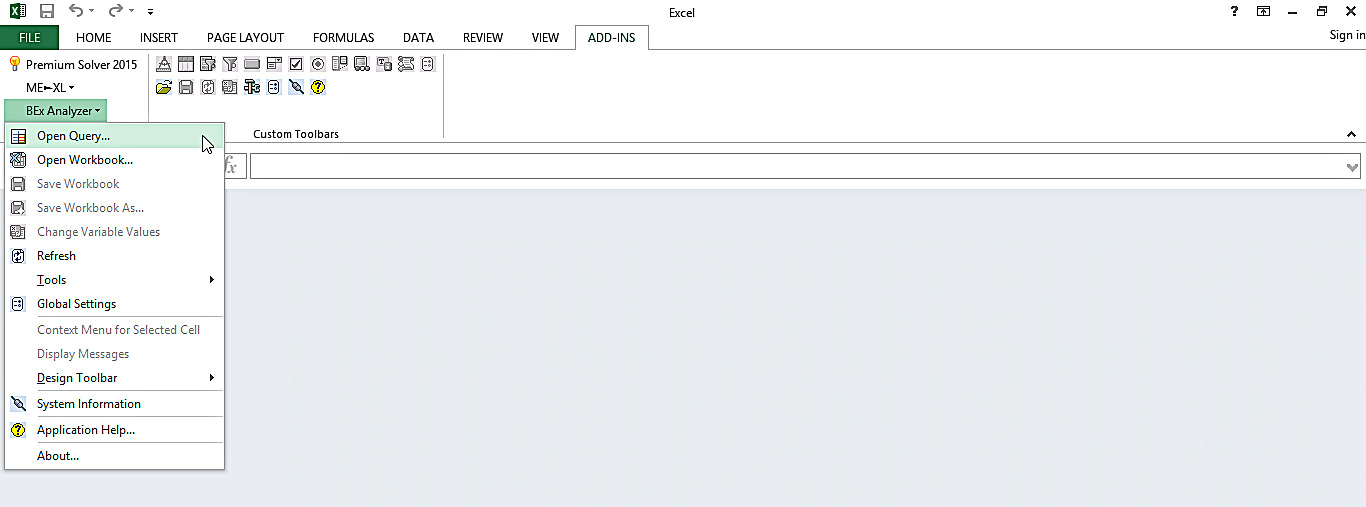
To start executing the query, you have to open the query in SAP BEx Analyzer by clicking on “Open Query…”:
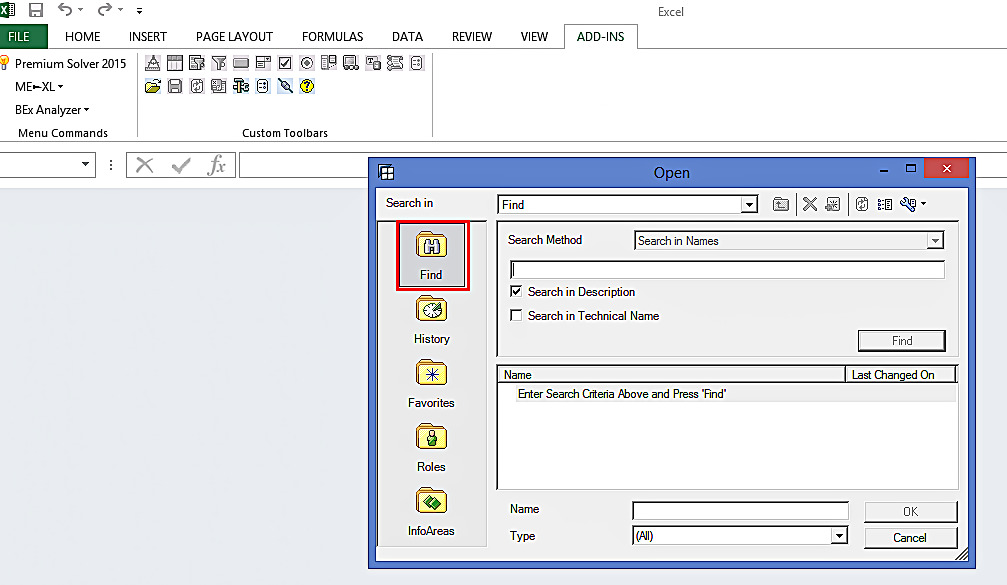
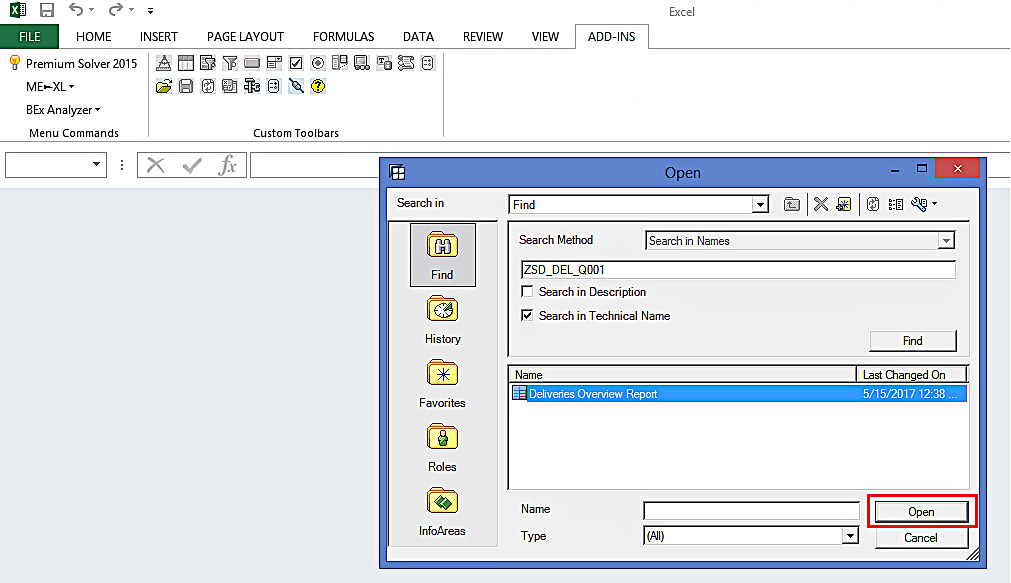
As part of this tutorial, let’s run ZSD_DEL_Q001: Deliveries Overview Report. Click on Find button to find the query. You can also search for the query in Favorites, Roles, InfoAreas, and History.
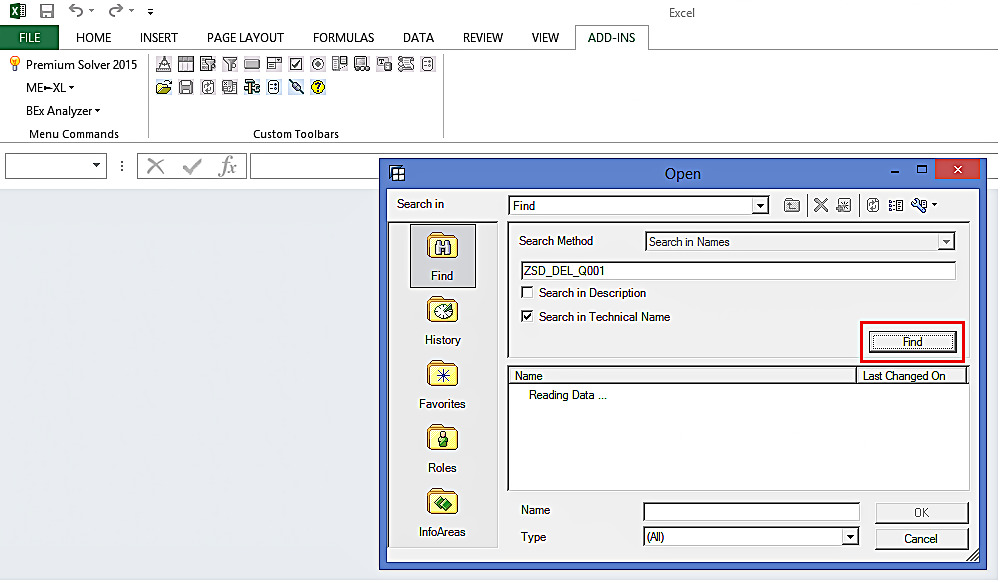
Now, you should mention the Query name and check the Search in Technical Name checkbox. Finally, click the Find button.
As can be seen from the below screenshot, the Deliveries Overview Report is found. Click on Open button highlighted in the screenshot.
SAP BEx Analyzer shows the below variable selection screen to complete the Query execution.
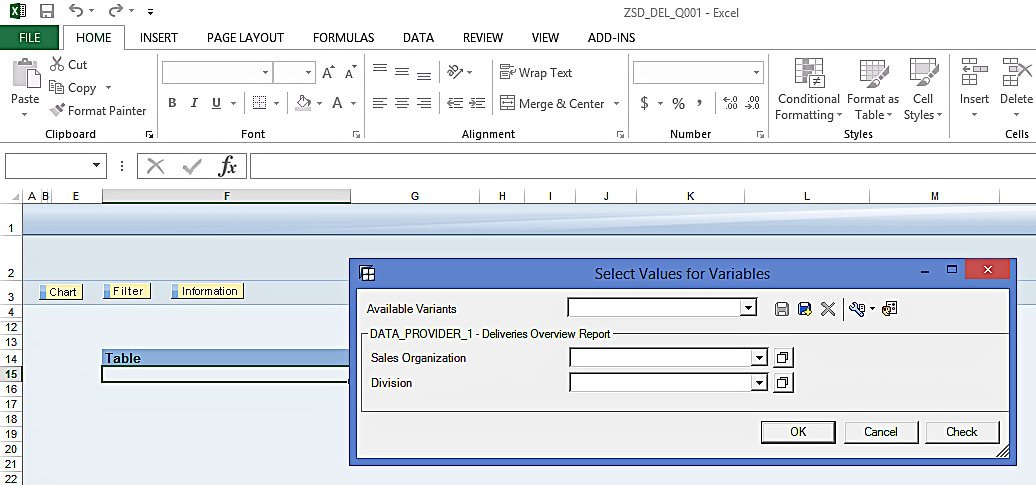
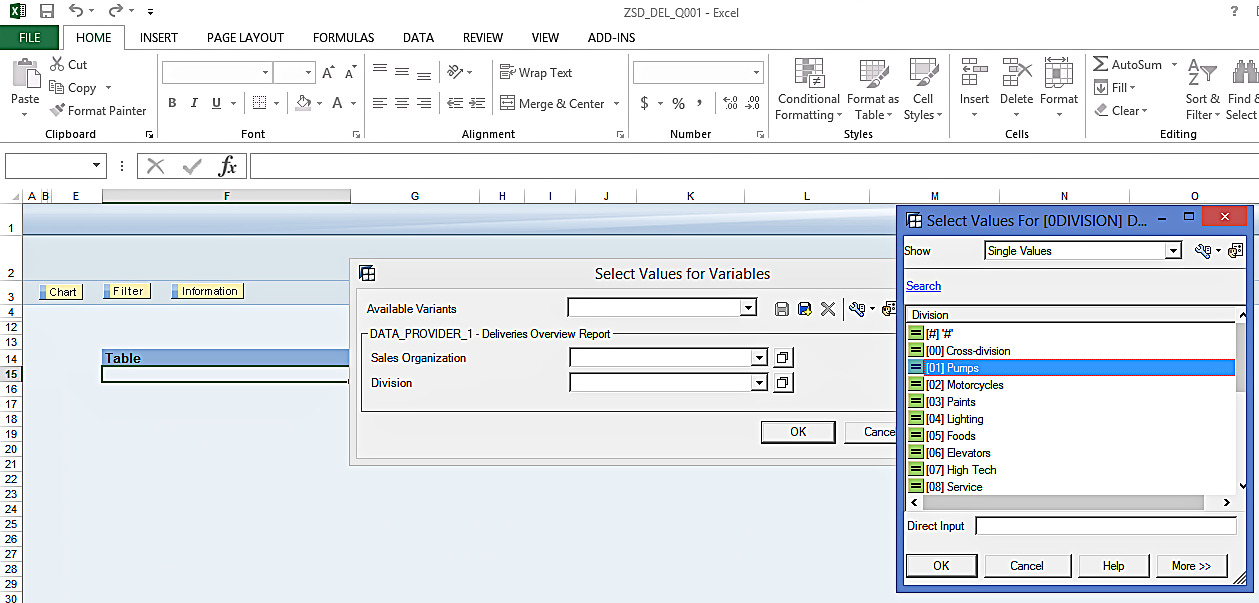
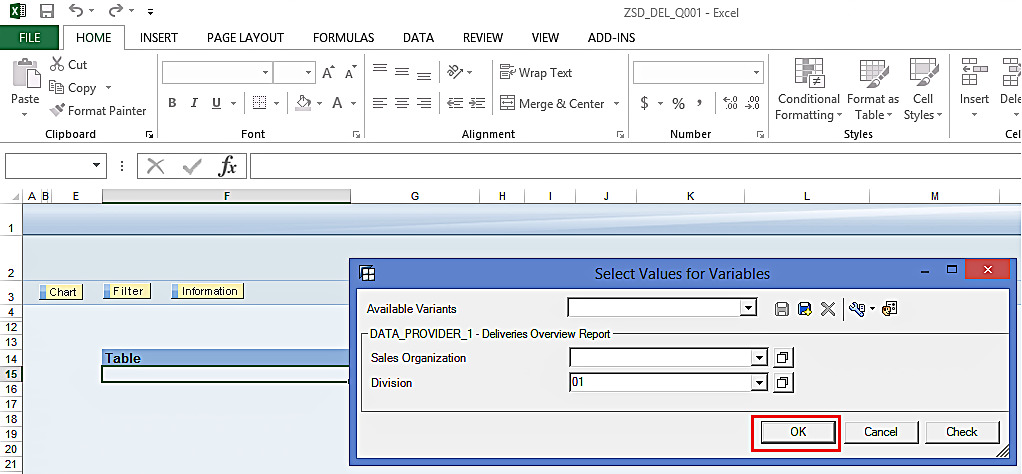
Now, select values for variables and execute the query using the OK button.
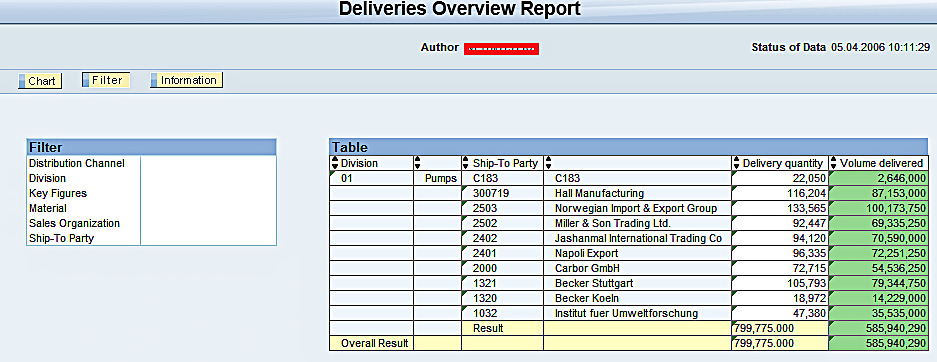
The Query output is given below.
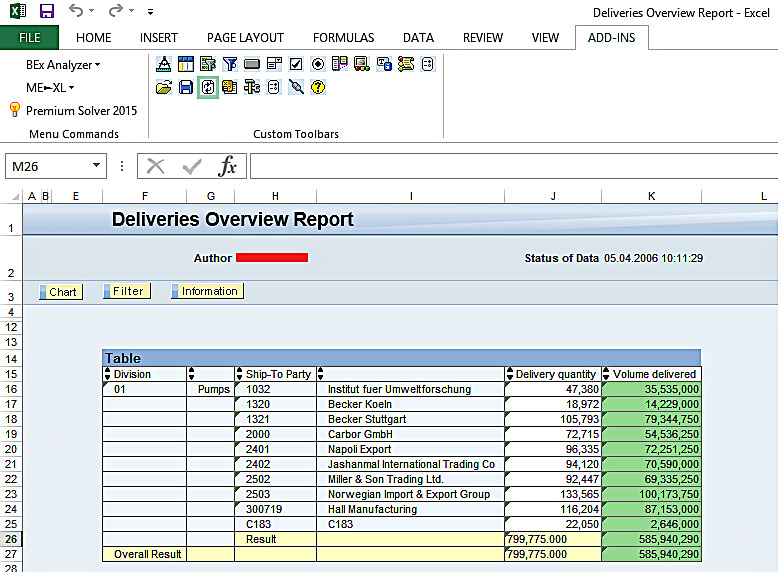
This is the default table display. You have four columns: Division, Ship-To Party, Delivery quantity, and Volume delivered. You can customize the look of the report with the help of several functions that are available in SAP BEx Analyzer: Chart, Filter, and Information.
Chart: The Chart button helps you see the data visually. You can also customize the chart, as the charts that are present in Excel.
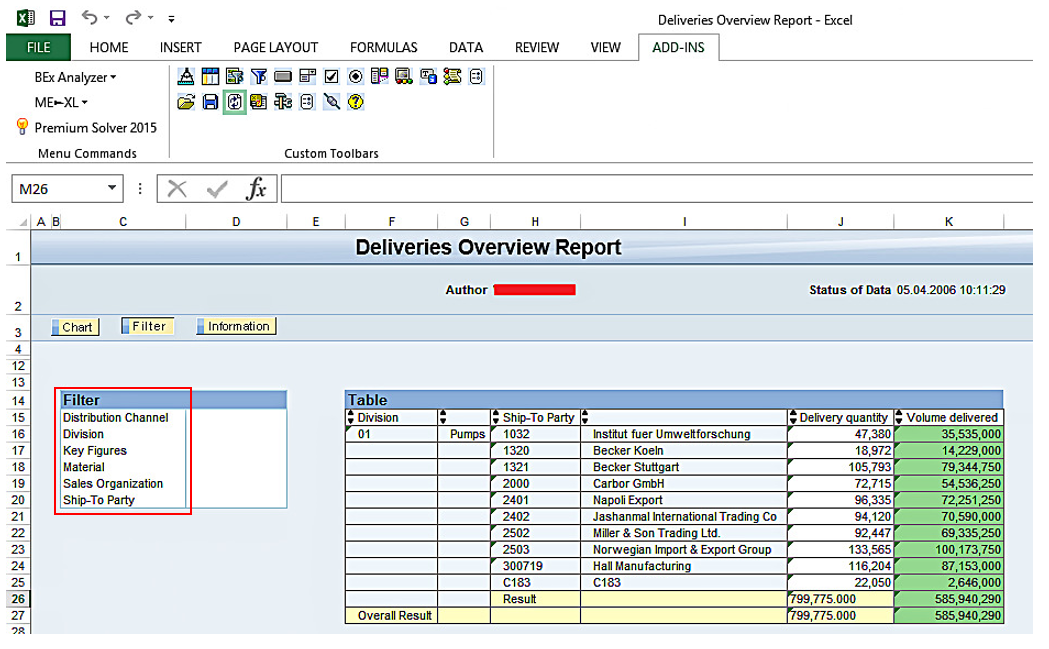
Filter: The Filter function shows a list of free characteristics that are available. You can drag and drop these characteristics anytime into your report.
Information: The Information function shows description of the report along with other technical details. All this extra information will be displayed at the top of the report.
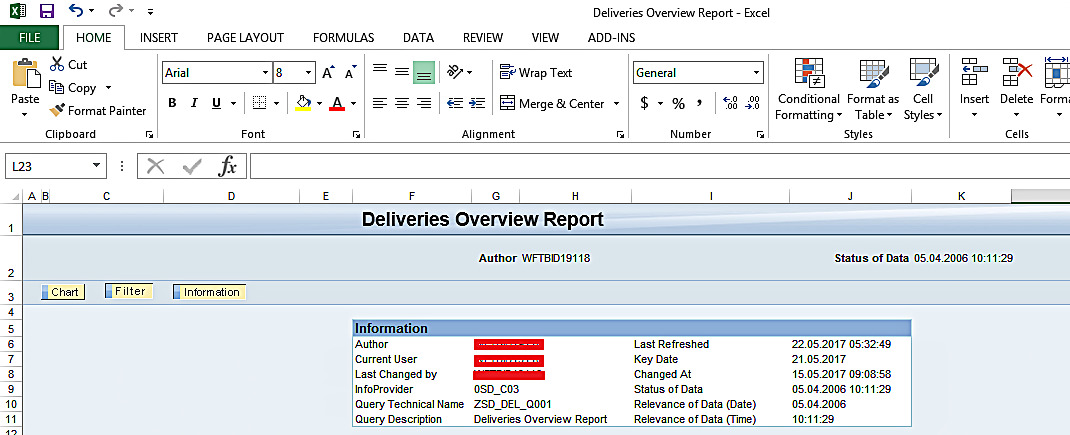
This information is extremely valuable as it can help you with finding issues with underlying data. For example, if you see certain erroneous records, you can go back to the InfoProvider and troubleshoot to find the issues.
Navigation in the Report
This part of the tutorial about SAP BEx Analyzer overview focuses on navigation options that are available in SAP BEx Analyzer.
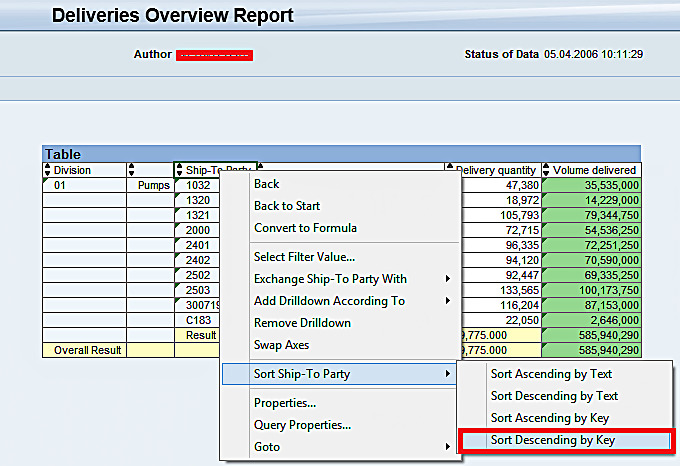
You can sort the fields by their key or text values. For instance, let’s sort the Ship-To Party field by their key value in descending order. Right click on Ship-To Party field available in the Table and follow the navigation: Sort Ship-To Party Sort Descending by Key.
Ship-To Party field is sorted and below is the report output:
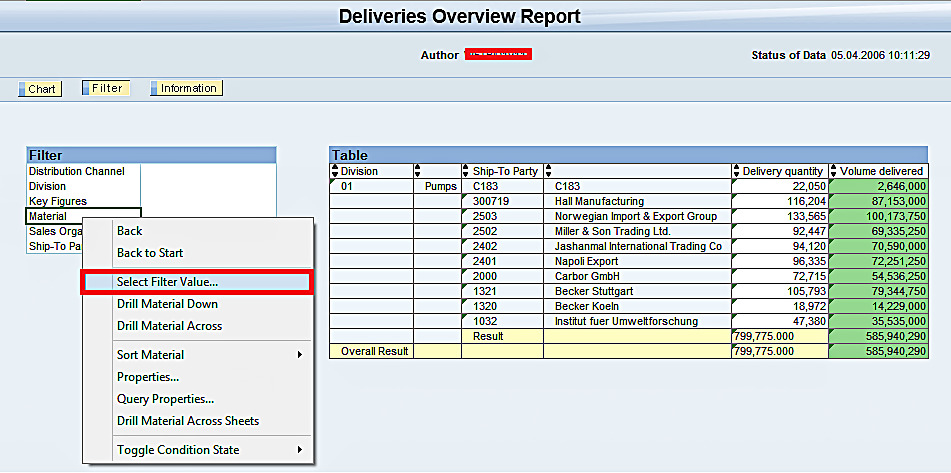
Let’s now filter the report on Material. Right click on Material, select Select Filter Value… menu.
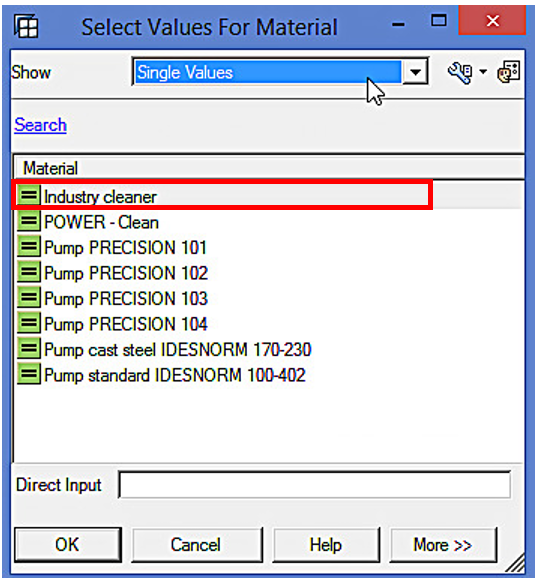
The following dialog box will appear. Choose the value you want to filter the report on, and click OK to proceed further.
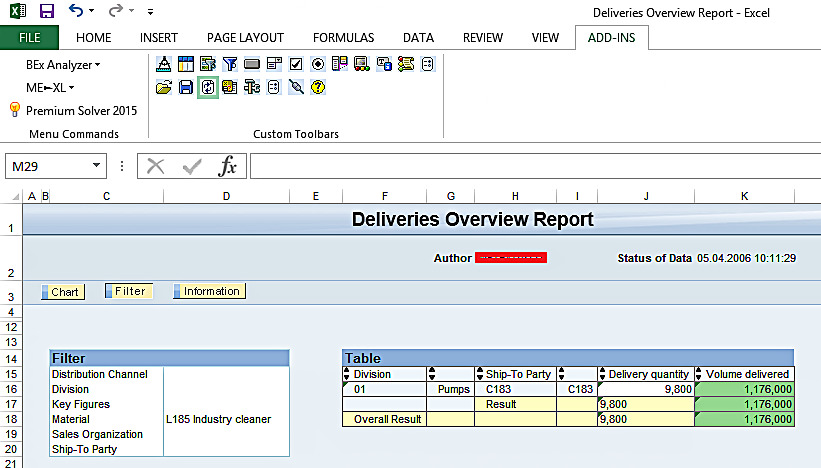
The filtered report is shown below:
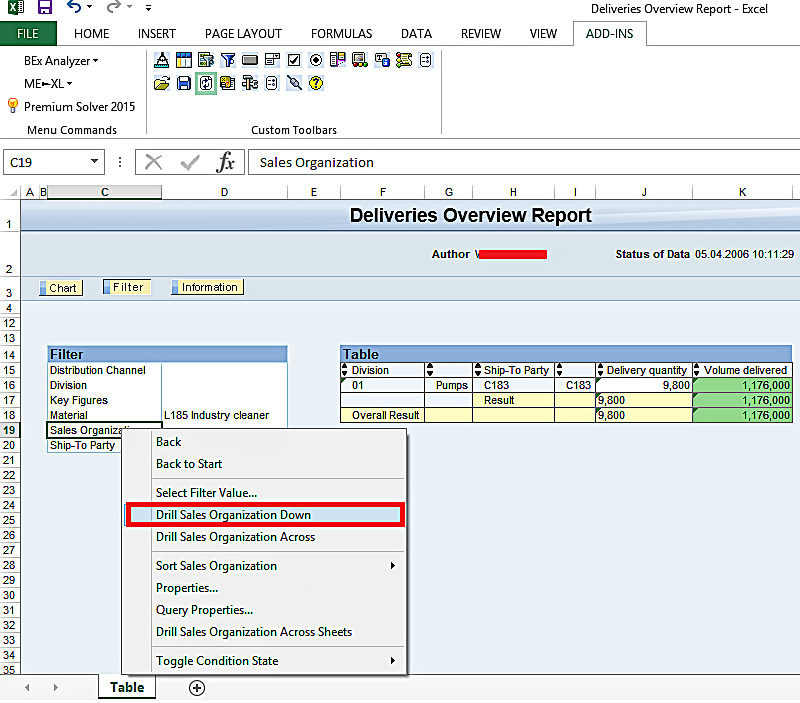
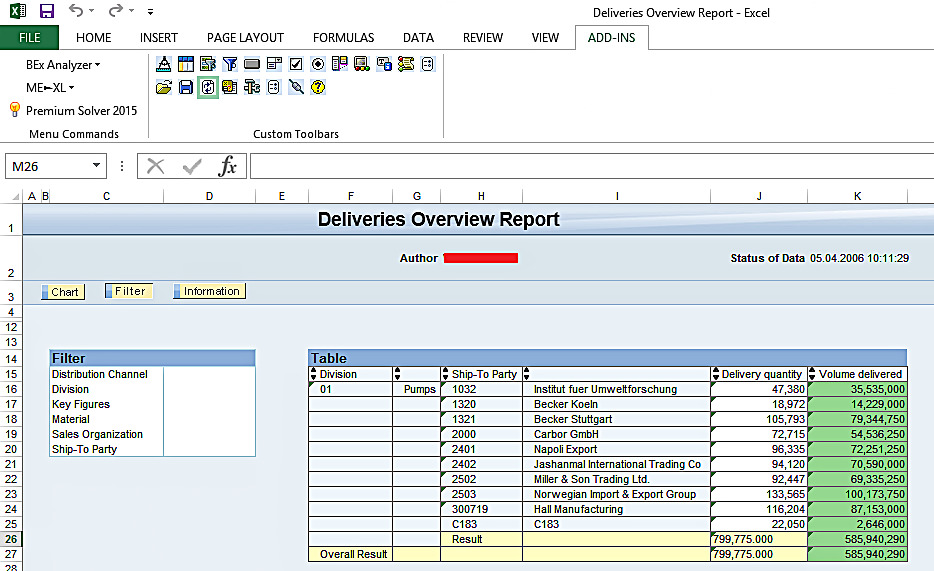
You can drilldown the report further by adding free characteristics available in Filters section of the report. For instance, let’s assume that the end users of Deliveries Overview Report want to see Delivery Quantity and Volume Delivered not just by Division and Ship-To Party but by Sales Organization. In this case, we have to add Sales Organization to the report.
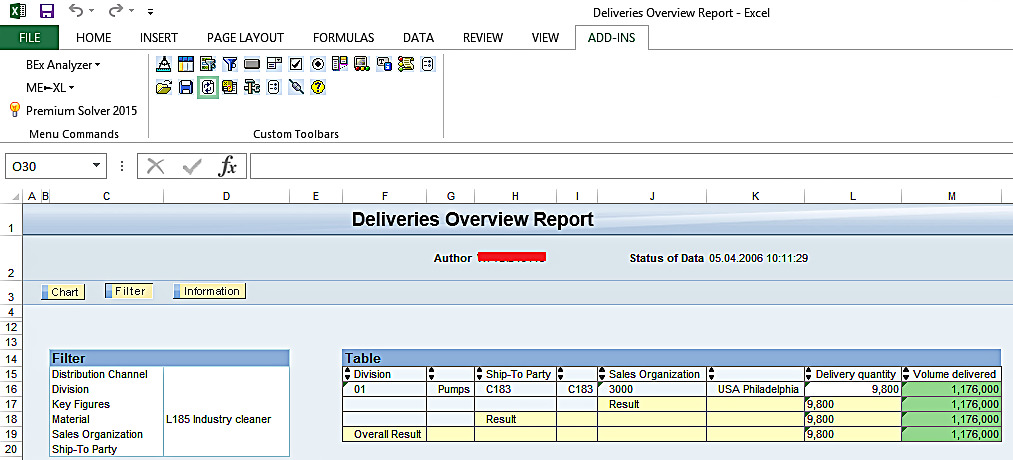
Here’s the report output:
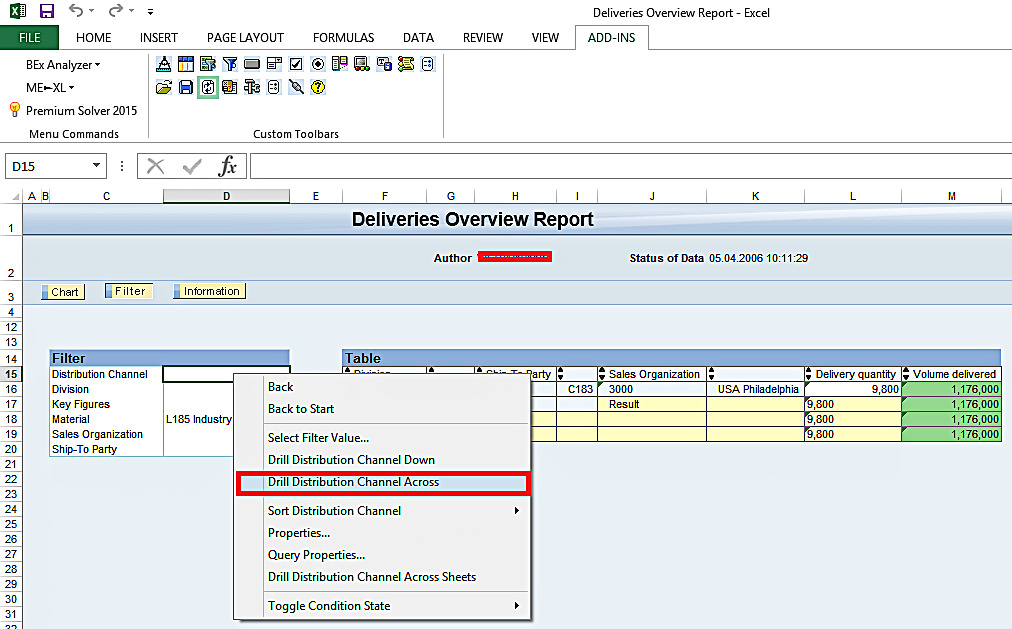
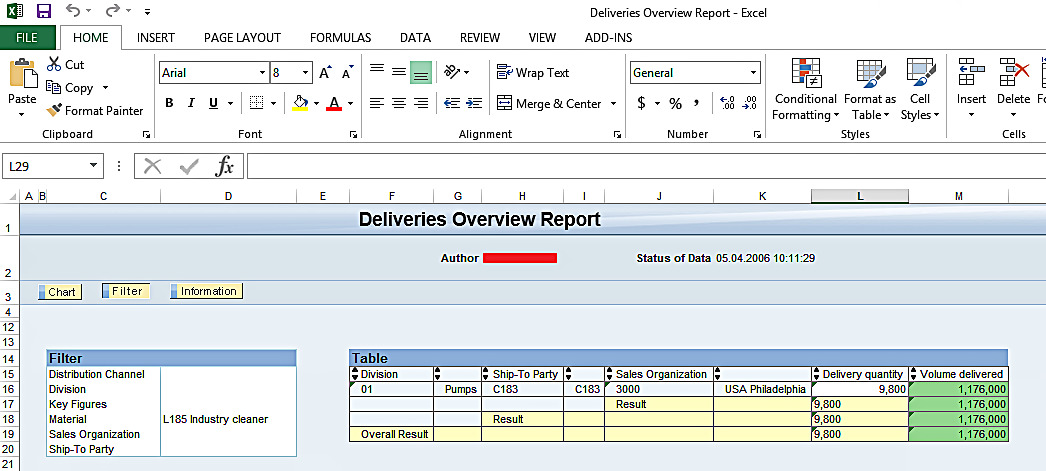
Like Drill Down, you can also Drill Across as per your need. This will drag the field over the key figures. For instance, if you want to drill across on Distribution Channel, just right click on Distribution Channel available in Filter section and click on Drill Distribution Channel Across.
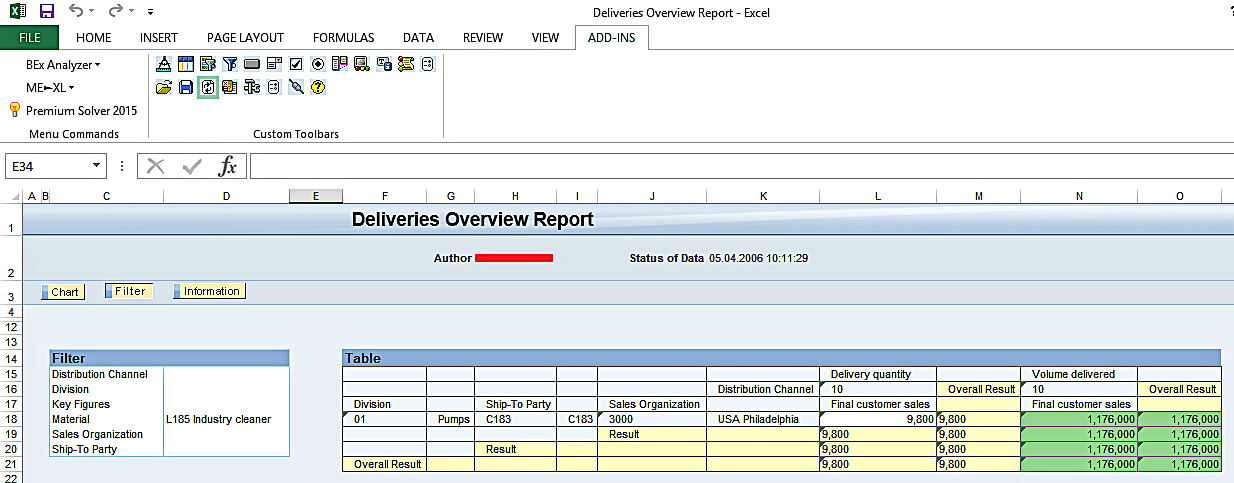
Here’s the report output:
You can also remove fields from the report output altogether. For instance, let’s remove Distribution Channel that we just drilled across the report. Right click on Distribution Channel in the report and click on Remove Drilldown.
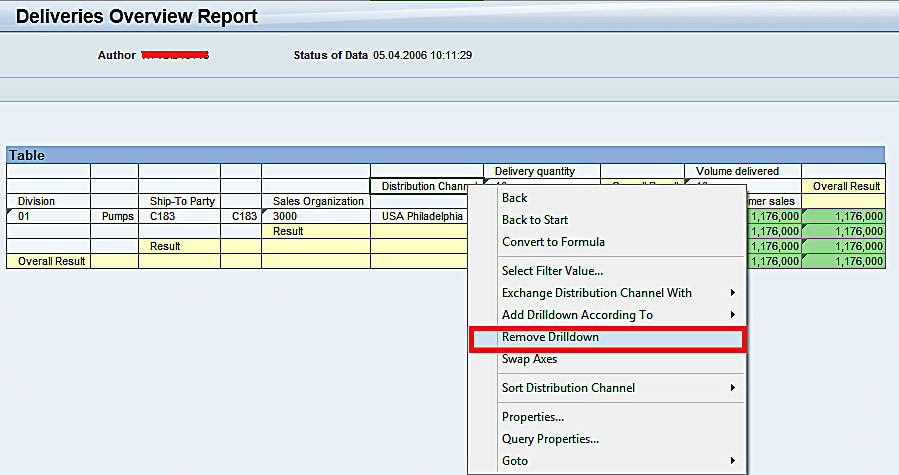
Here’s the report output:
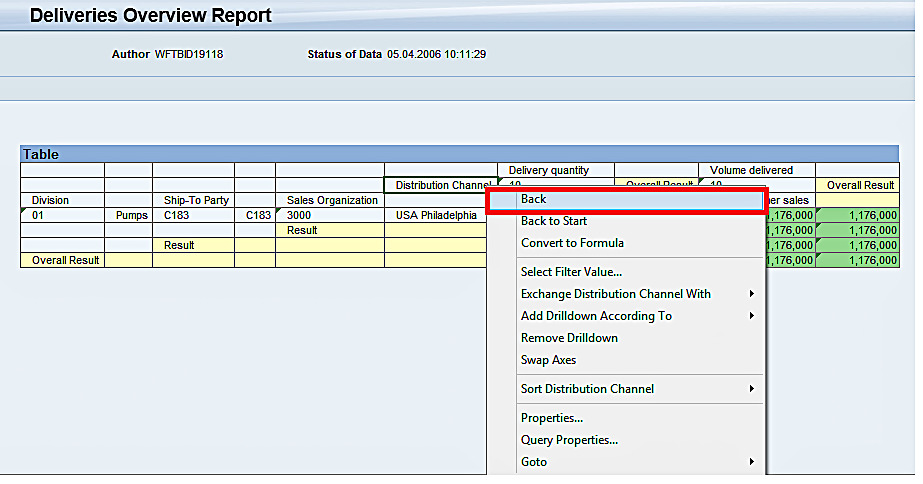
In SAP BEx Analyzer, there is always more than one way of doing things. For instance, you can also just drag the header row to an area outside of the table to get the same output shown in the above screenshot. Similarly, you can simply right click on Distribution Channel in the report and click on Back as highlighted below to get the same output shown in the above screenshot.
Sometimes, it so happens that you just want to apply filters with the data that is displayed in the table. For instance, let’s take the initial query output which we got with default table display. Report output is given below again for your reference.
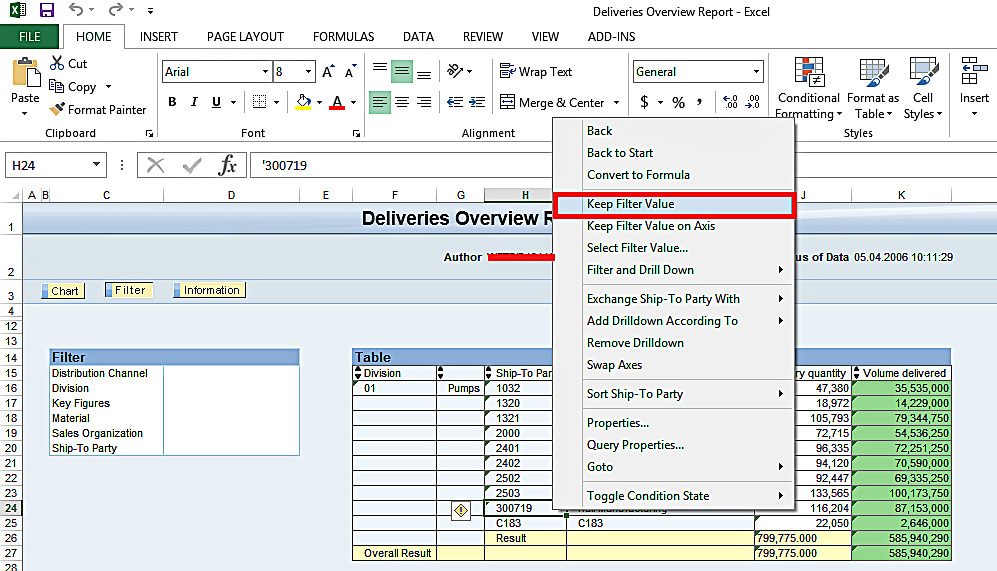
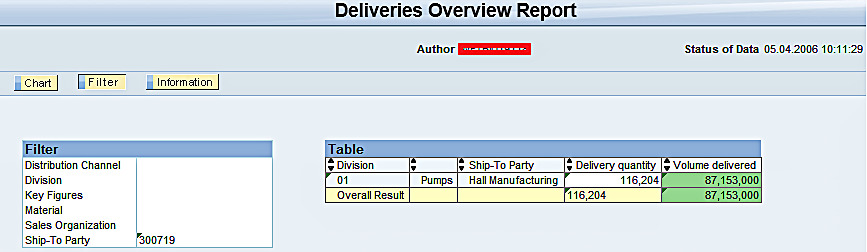
Now, let’s keep filter on Hall Manufacturing Ship-To Party. Right click on the value on which you want to keep the filter on. Then, click on Keep Filter Value highlighted in the below screenshot.
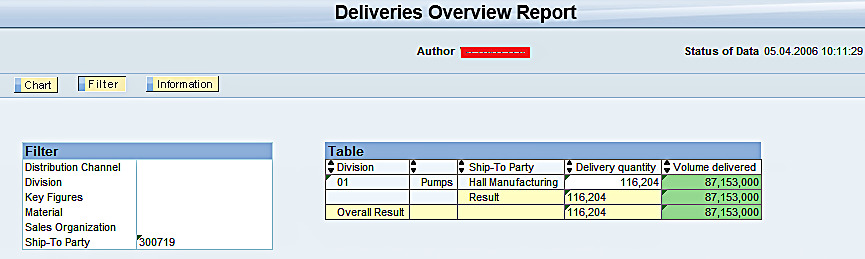
The filter is applied and below given is the report output.
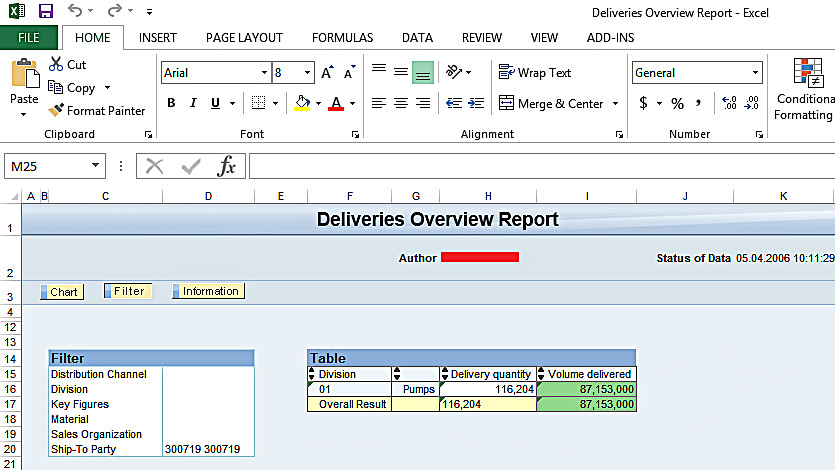
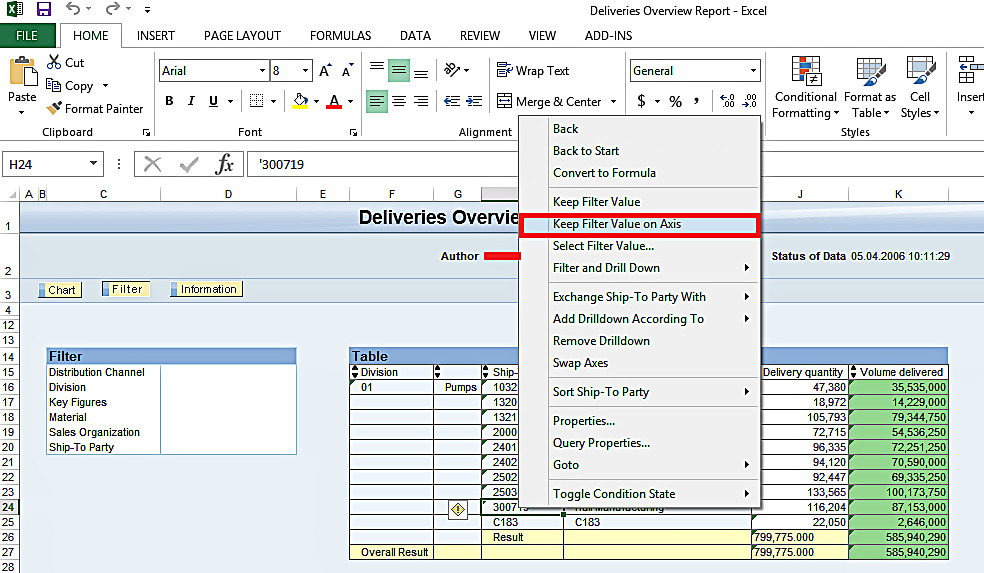
You can notice from the above screenshot that the table has been filtered, and the Filters section shows that Ship-To Party has been filtered on 300719 which is Hall Manufacturing. There are also other options such as Keep Filter Value on Axis which would leave the field in place.
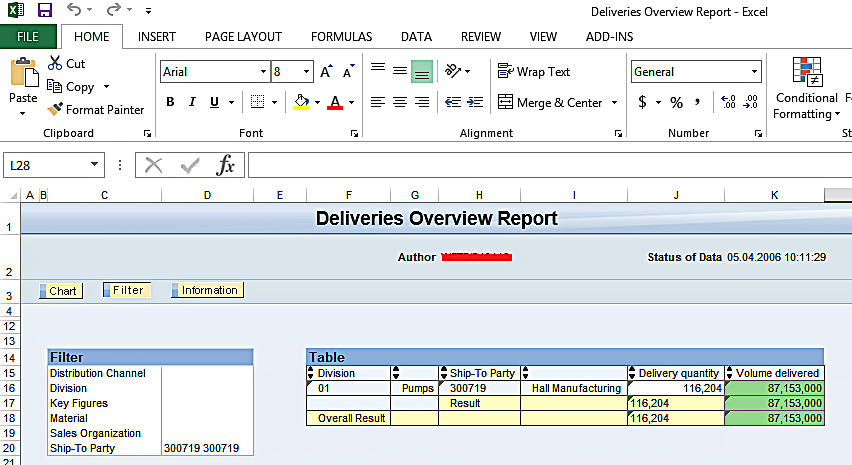
The filter is applied and the field is retained in the table. Below given is the report output.
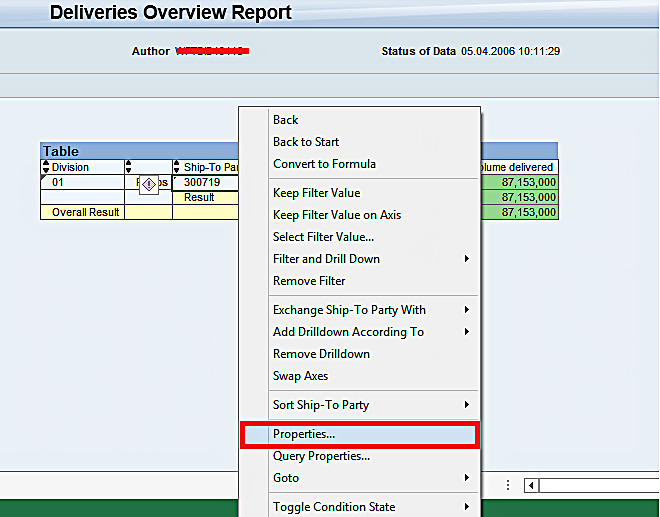
You can also change the presentation of the fields in the report. For instance, if you just want to see the text for Ship-To Party, you can go to the properties of the field and make the necessary changes in the settings. Right click on Ship-To Party field available in the table and click on Properties… highlighted in the below screenshot.
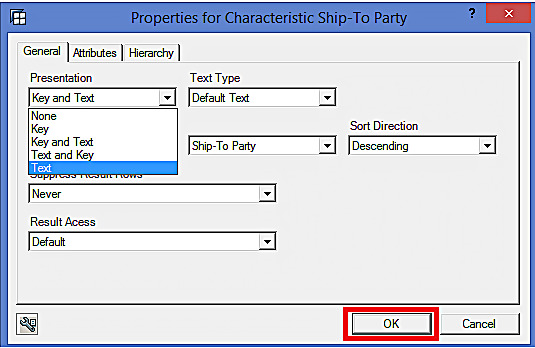
Now, change the presentation from Key and Text to Text and click on OK highlighted in the below screen.
Below given is the report output. You can see that Ship-To Party is now presented as just Text.
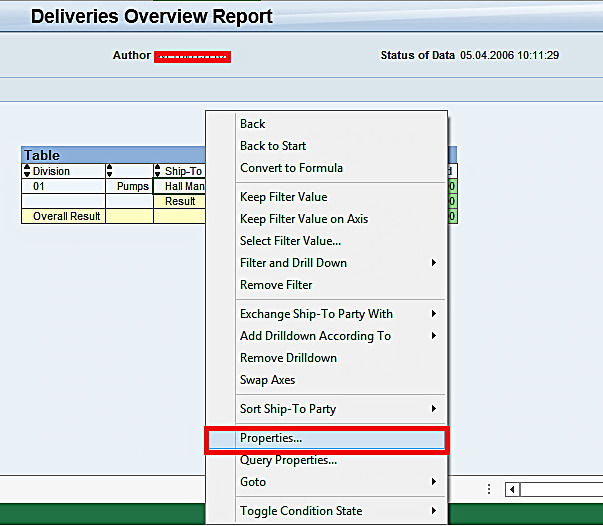
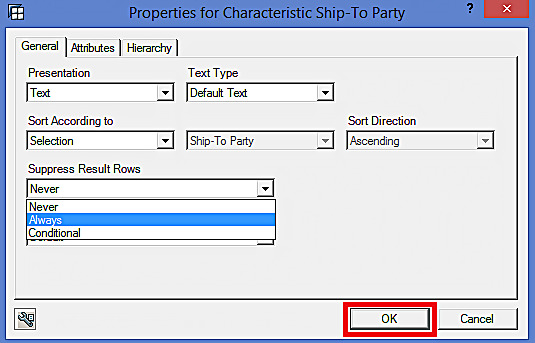
Let’s now take a look at Suppress Result Rows property. When you create a BEx query, the characteristics almost always generate subtotals. For instance, if you want to remove subtotals for Ship-To Party field, right click on Ship-To Party field available in the table and click on Properties… highlighted in the below screenshot.
Now, change the Suppress Result Rows from Never to Always and click on OK highlighted in the below screenshot.
Below is given the report output. You can see that subtotals for the Ship-To Party field have been removed.
There are also other options such as swapping axes and toggling condition state. You have to become familiar with all the functionalities of SAP BEx Analyzer to see how much time you can save by executing the reports with ease. We hope that this tutorials with SAP BEx Analyzer overview will become a good starting point for you.
—
Did you like this tutorial? Have any questions or comments? We would love to hear your feedback in the comments section below. It’d be a big help for us, and hopefully it’s something we can address for you in improvement of our free SAP BW tutorials.
Navigation Links
Go to next lesson: SAP BEx Query Designer – How to Create a Simple Query?
Go to previous lesson: SAP BEx Tools Overview
Go to overview of the course: SAP BW Training